
Security Operations Dashboard
A cybersecurity platform needed to visualize threat data from a dozen connected tools in a single view a security analyst could scan in seconds.
XDR Security Ops Dashboard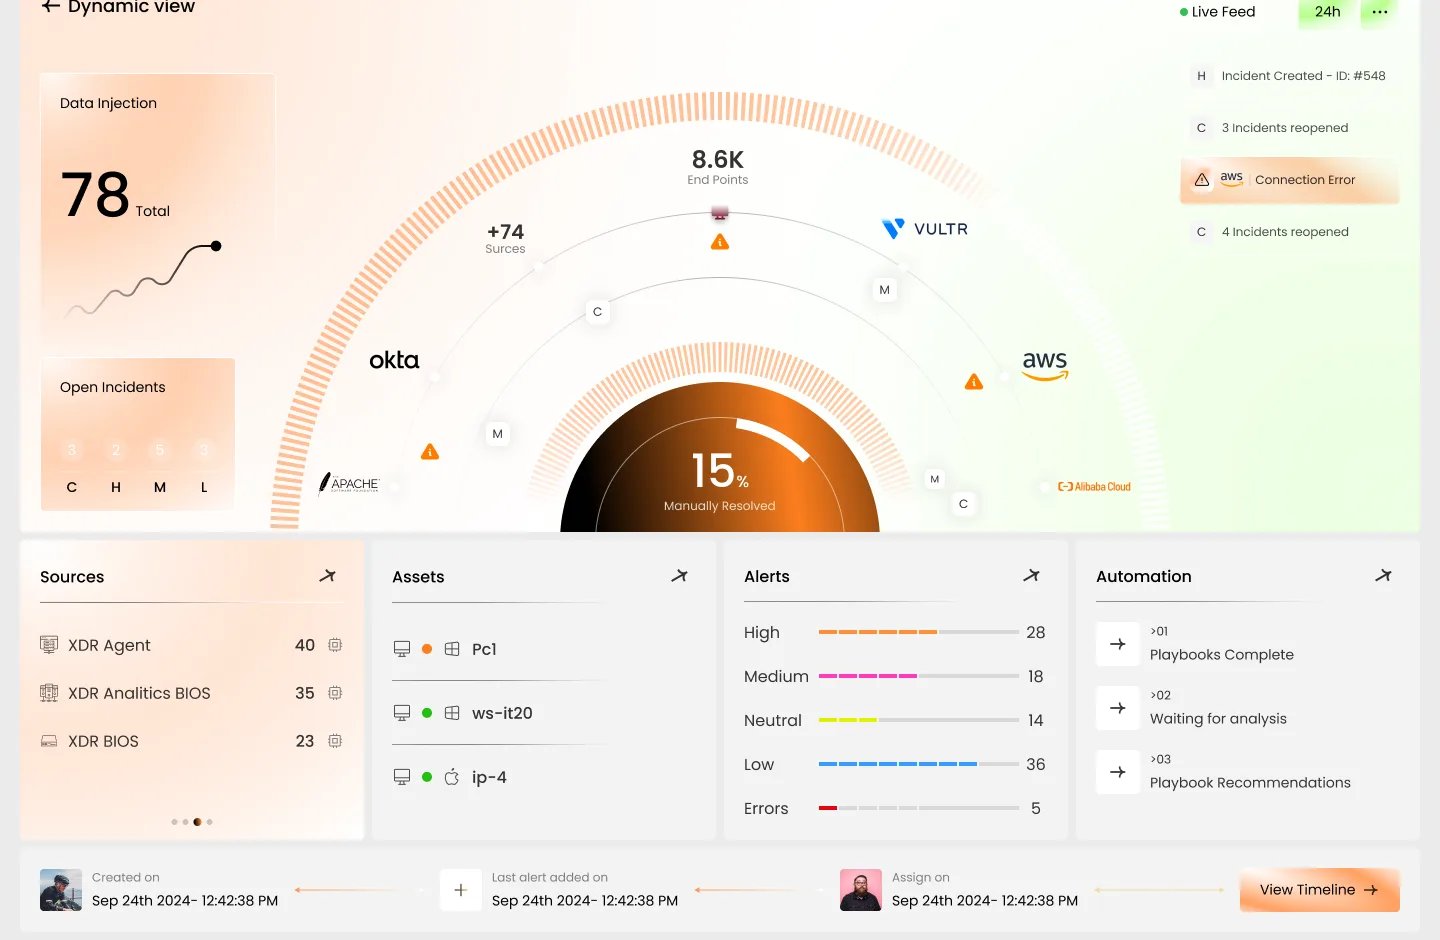
Challenge
Security operations centers work across many integrated tools at once — cloud providers, endpoint agents, identity platforms — and the dashboard needed to unify them without hiding which system an alert came from.
Approach
We designed a radial threat-map as the dashboard's centerpiece, with connected-tool logos placed around it, so an analyst can see both overall risk posture and its source at a glance.
Solution
A full security operations dashboard — live incident feed, asset inventory, alert severity breakdown, and automated playbook status, unified around one radial threat visualization.
What Shipped
Radial threat-map visualization design
Live incident feed with severity tagging
Multi-integration asset inventory view
Automated playbook status tracking UI